|
Exam information | Describing line graphs
A line graph shows how the value of something changes over time. The vertical axis shows quantities, e.g. numbers, percentages or money.The horizontal axis shows different points in time, usually months or years. Different quantities measured at different points in time can be joined using a continuous line to show a trend or how these quantities change, e.g. increase, decrease, or stay the same. More lines (different colours or styles) can be used for different categories. The key explains which categories are being measured.
1. Look at the line graph and write T (true) or F (false) next to the sentences below.
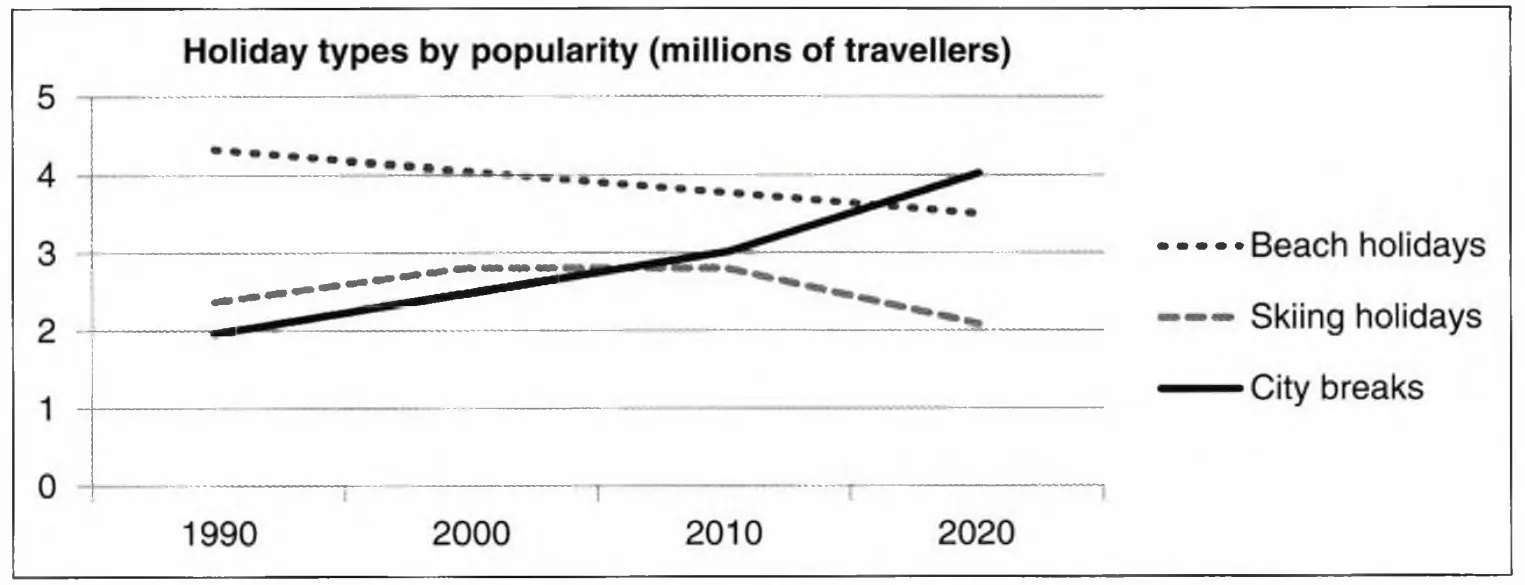
1. The graph shows the popularity of three different types of holiday from 1990 to 2020 in millions of travellers.
2. City breaks increased gradually from 2 million travellers in 1990 to 3 million in 2010.
3. There was a slight increase in skiing holidays after 1990, then they remained stable for about 5 years.
4. From 2010 to 2020 it is predicted that there will be a sharp rise in the number of people who go on skiing holidays.
5. Beach holidays have decreased gradually from over 4 million to 3.5 million travellers.
6. From 2010 to 2020 there was a sharp drop in the number of people who went on skiing holidays.
Exam tip | Tense
Check the horizontal axis to find the periods of time the graph refers to: past, present, future, or all three.
Use the present simple to describe the graph: The graph shows ..., We can see ...
If the graph refers to past periods of time, use the past simple to describe these.
If the graph includes future times, use: It is predicted that..., ... will...
2. Look at the line graph and complete the sentences with the correct forms of the verbs in brackets.
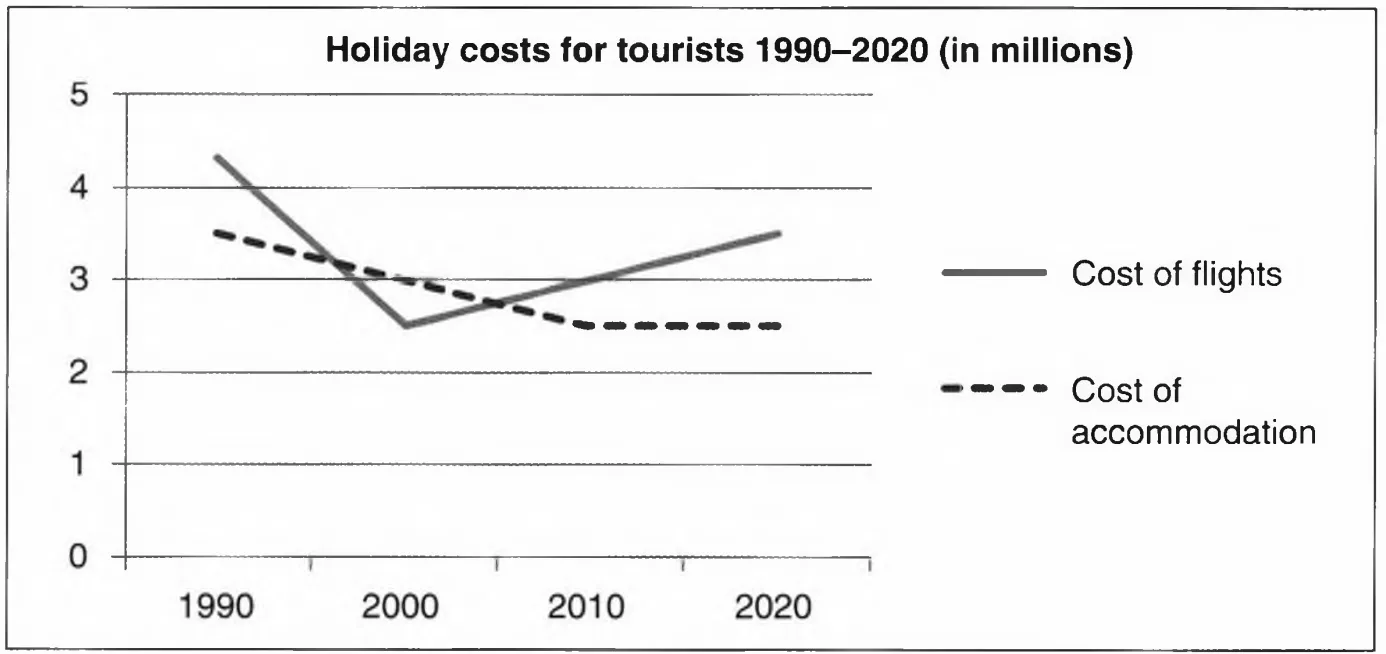
1. The line graph the cost of holidays for tourists from 1990 to 2020. (show)
2. Between 1990 and 2000 the cost of flights rapidly. (drop)
3. The cost of accommodation gradually for thirty years after 1990. (go down)
4. It is predicted that the cost of accommodation from 2010 to 2020. (stay the same)
3. Look at the line graph and complete the text with the correct forms of the verbs in brackets and the correct prepositions.
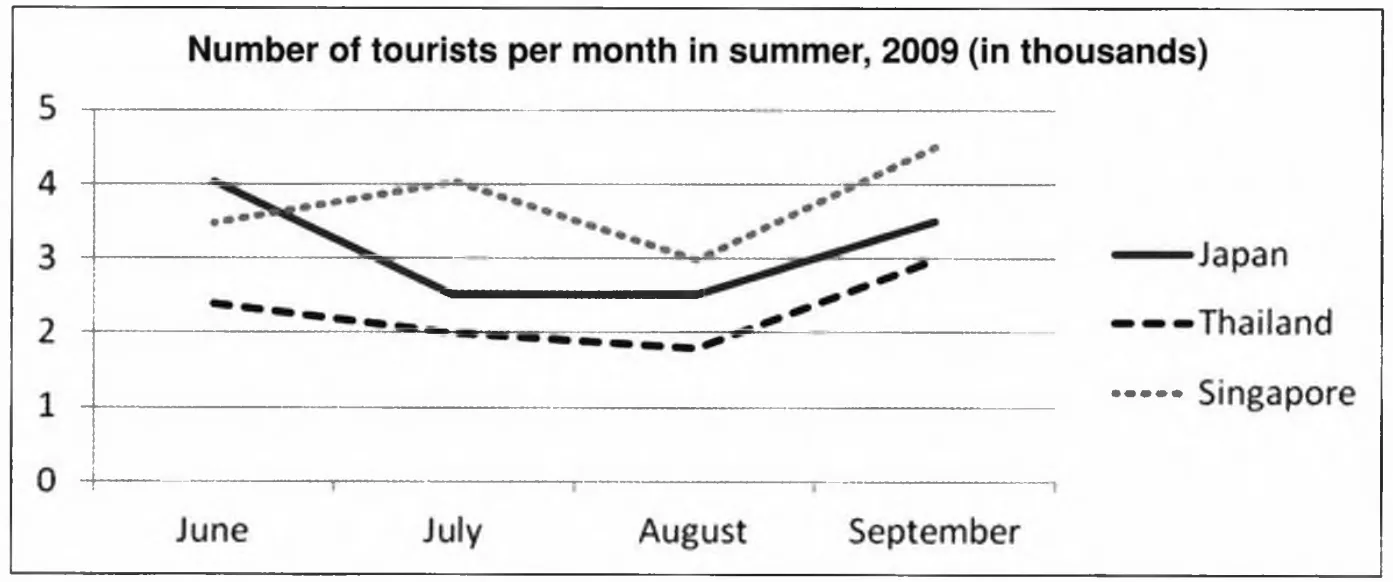
The graph (1) (show) how many tourists (2) . (visit) three
countries in the summer of 2009. Most tourists (3) (go) to Singapore
(4) June and September. The number (5) . (fluctuate) between
3.5 and 4.5 thousand. Fewer tourists (6) (travel) to Japan and Thailand.
The number of people who visited Thailand (7) (drop) gradually from 2.5
thousand to about 1.8 from June to August then (8) (rise) to 3 thousand
(9) September. We can (10) . (see) that the trend for Japan
(11) (be) similar. There was a sharp drop in tourists from June to July. The
number (12) (remain stable) in August and then (13) .(increase)
steadily in September.
|
