Writing Task 1
You should spend about 20 minutes on this task.
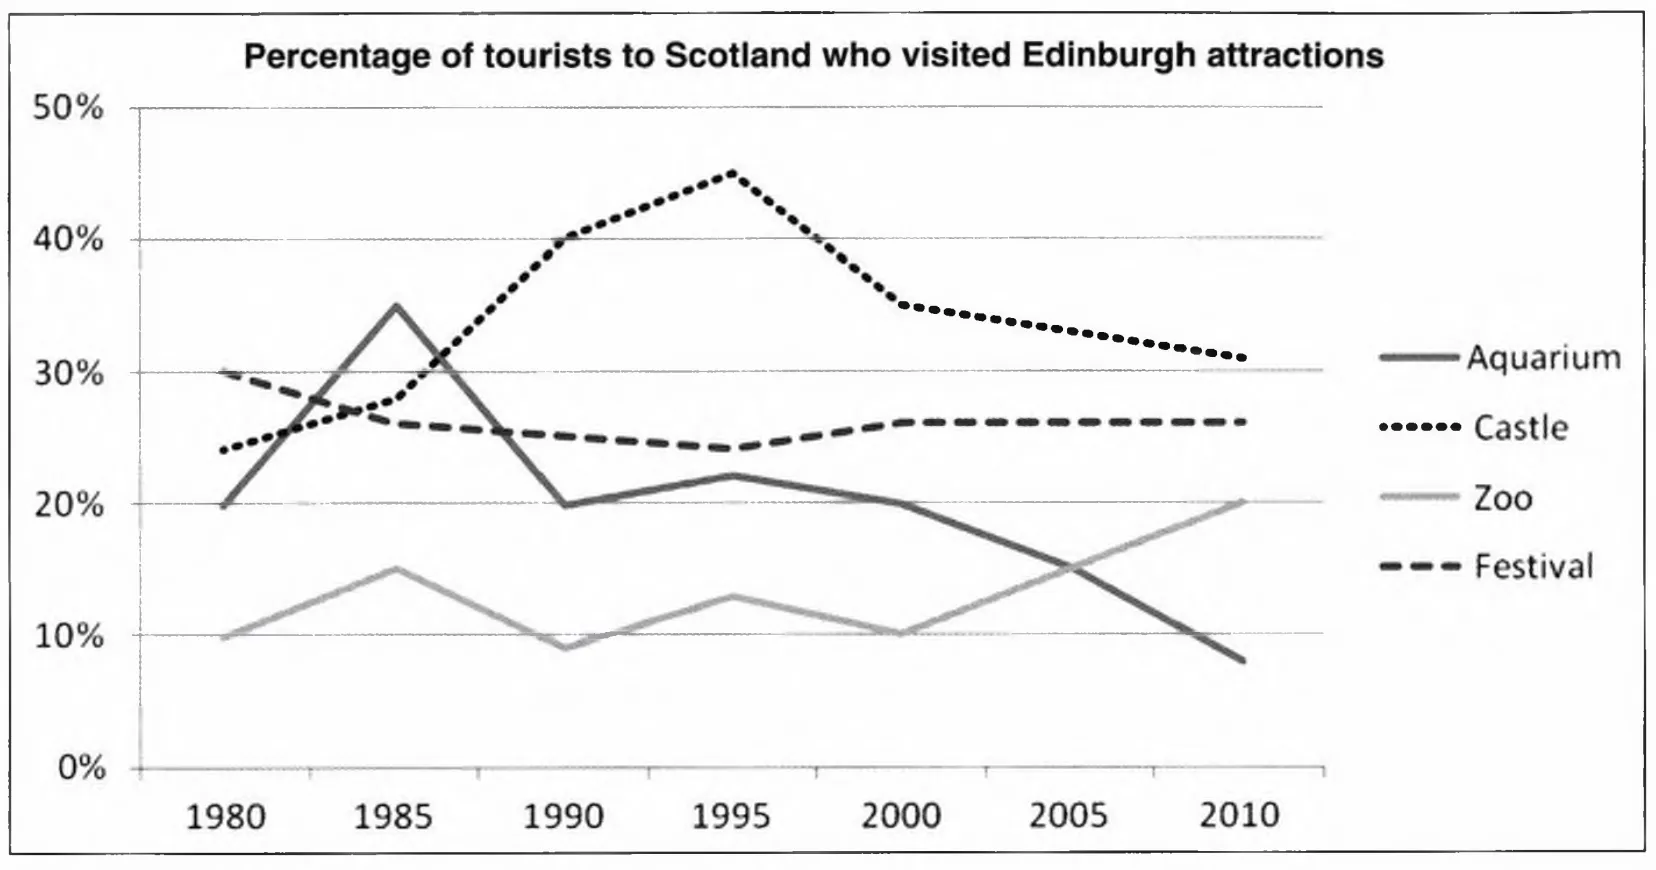
The line graph below shows the percentage of tourists to Scotland who visited four different attractions in Edinburgh. Summarize the information by selecting and reporting the main features, and make comparisons where relevant.
Write at least 150 words.
Model Answer
The line graph shows the percentage of
tourists to Scotland who visited certain
Edinburgh attractions between 1980 and
2010. We can see that in 1980 and in 2010
the favourite attractions were the castle
and the festival. In 1980 the least popular
attraction was the zoo but in 2010 this
changed and the aquarium was the least
popular.
During the 1980s and 1990s there was a
rapid increase in visitors to the castle from
25% to 45% and then the percentage gradually
went down to 30% in 2010. The trend for the
aquarium was similar to the castle. Visitors
increased rapidly from 20% to 35% from 1980
to 1985 then gradually decreased to less
than 10% over the next twenty-five years. The
number of tourists who visited the festival
fluctuated slightly but in general remained
stable at about 25%. Visitors to the zoo also
fluctuated from 1980 to 2000 then rose
sharply from 10% to 20% between 2000 and
2010.
Progress check
How many boxes can you tick? You should work towards being able to tick them all.
Did you ...
☐ use the correct nouns, verbs, adjectives and adverbs to describe changes in graphs?
☐ use correct word order?
☐ use the correct prepositions with time phrases?
☐ check whether the information in the line graph is about the past, present or future and use the correct tense(s)?
|
