Put the sentences describing the bar chart in the correct order by numbering them 1-5.

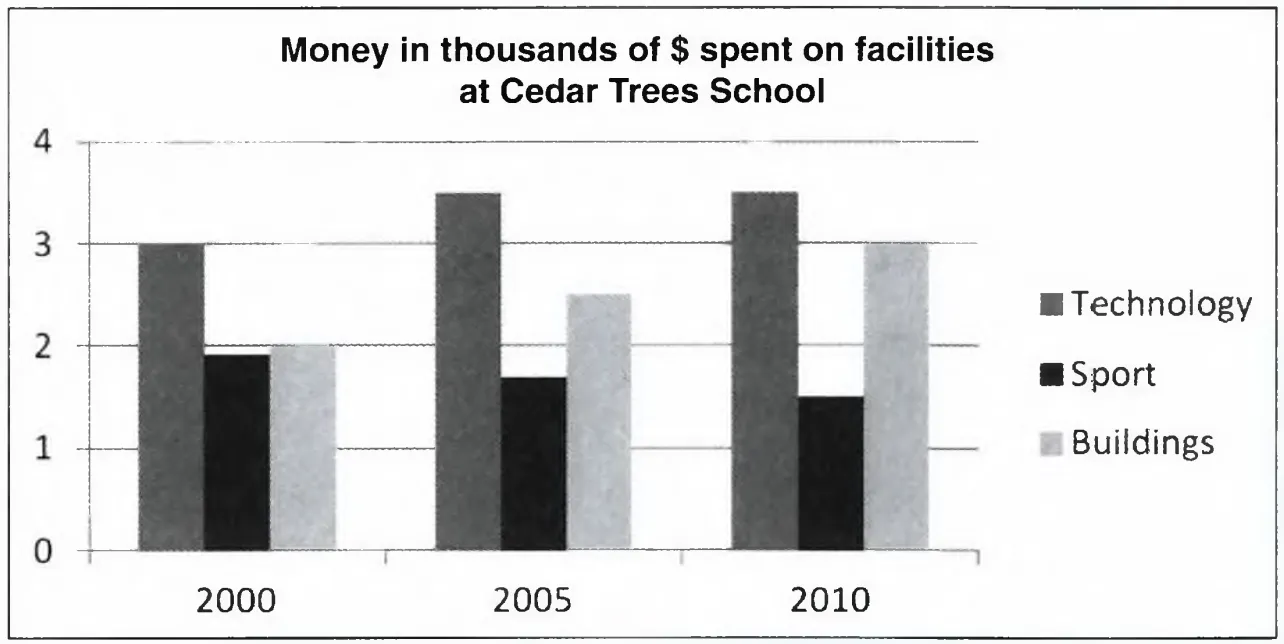
From 2000 to 2010 the school increased the money spent on technology from $3,000 to $3,500.
We can see that in general the school spent most money on technology.
The graph shows how much money CedarTrees School spent on different facilities from 2000 to 2010.
However, not as much money was spent on sport in 2010; the money for sport went down from $2,000 to about $1,500.
Also, the money for buildings rose from $2,000 to $3,000.
|

