Exam information | Comparing more than one table
For Task 1 you may have to compare and describe two or more charts, graphs or tables. These may show information about the same topic but focus on different aspects.
You will need to understand what information each chart / graph / table shows and find any relationships between them, e.g. notice a change in one table / chart / graph that may be caused / be the cause of a change in another table / chart / graph.
1. Look at the bar chart and the two pie charts below and complete the sentences opposite.
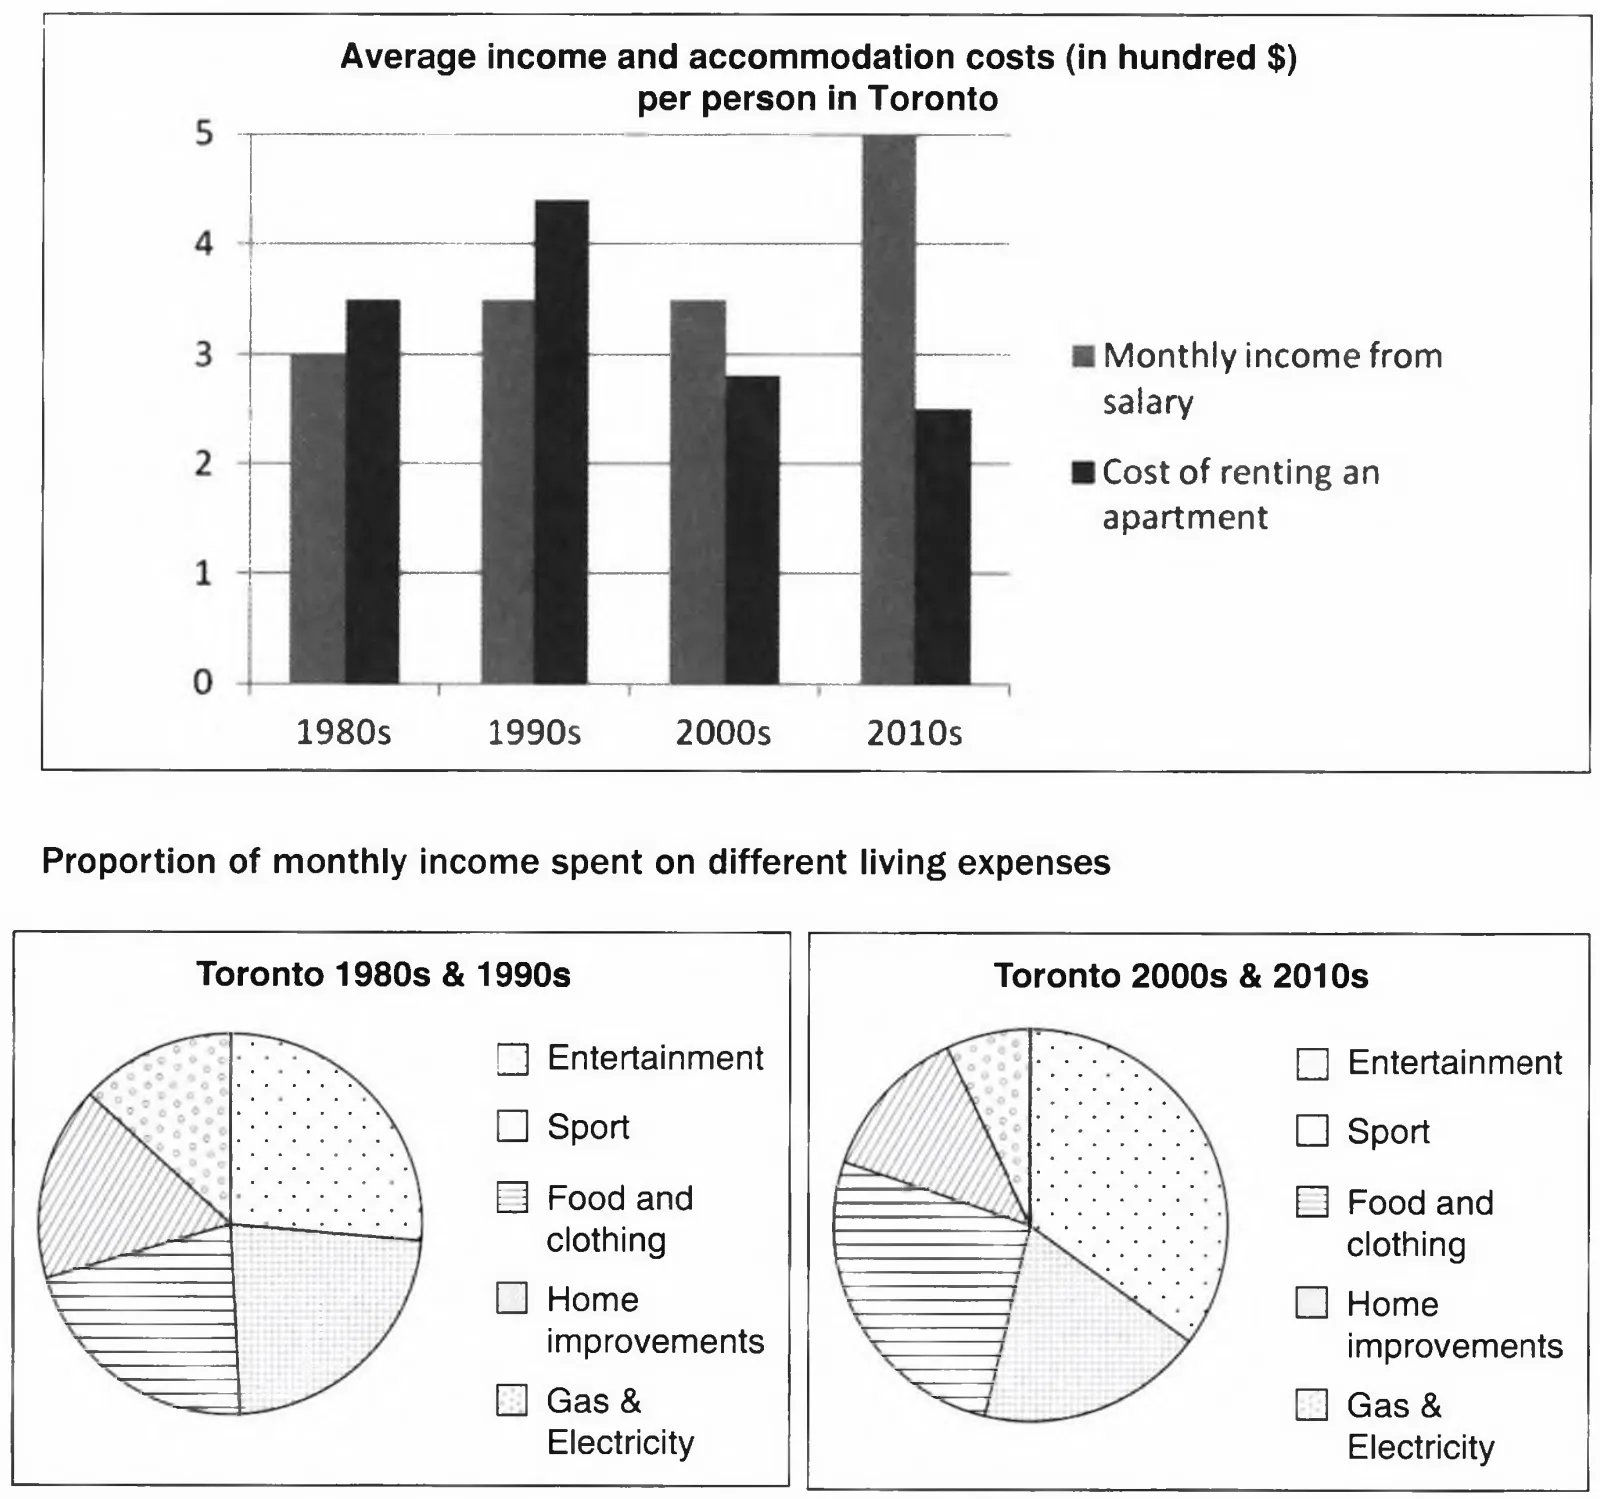
1. During the 2000s and 2010s people in Toronto spent more on entertainment because they
2. Due to higher monthly salaries people spent more on food and clothing in the
3. Spending on entertainment was in the 1990s because the cost of renting an apartment was high.
4. People spent more on sport and entertainment in the 2000s because it was to rent an apartment.
5. In the 1990s the was the highest so people spent less on other things.
6. In the 2010s monthly salaries were high and rent costs were low so people spent more on than in the 1990s.
Exam tip | Main trends
Remember to find the main trends shown by the graph(s) / chart(s). Don't describe all the details of the information shown. Look at these example sentences describing the charts in Exercise 1:
The cost of renting an apartment was low in the 2000s so people spent more on other things. = MAIN TREND
Spending on gas and electricity in Toronto was higher in the 1980s than in the 2000s. = DETAIL
2. Now read the following sentences and decide which are the main trends and which are details according to the charts in Exercise 1. Write M (main trends) or D (details).
1. The money spent on home improvements was less in the 2000s and 2010s.
2. Spending on leisure activities grew over this period.
3. Monthly incomes in Toronto increased from the 1980s to 2010s.
4. The cost of renting an apartment has decreased since the 1980s.
5. People have spent more on entertainment and sport in recent years.
6. From the 1980s to the 1990s monthly salaries and the cost of renting an apartment increased.
7. In the 2010s people's spending on entertainment was higher.
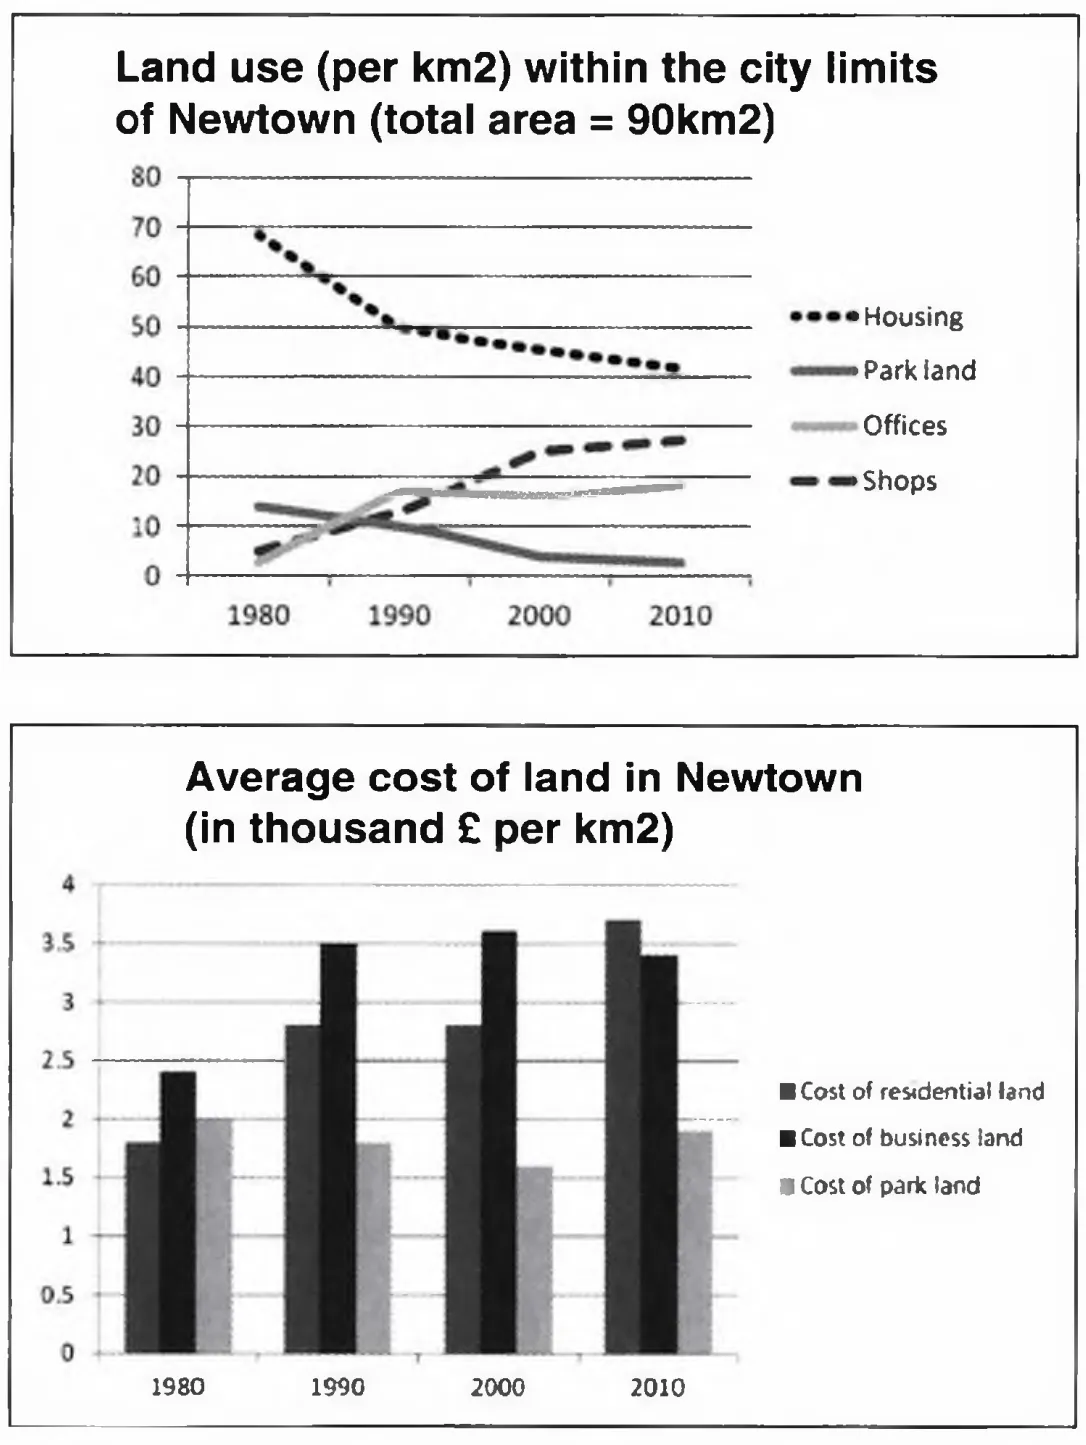
3. Look at the graph and the bar chart below and decide if the sentences are True or False.
Write T or F.
1. Land used for housing has decreased since 1980.
2. The city of Newtown has expanded the amount of its park land over the last 30 years.
3. The cost of all land types increased in 2010.
4. In 2000 more land was used for housing than for offices and shops.
5. The price of business land was the highest in 1980.
6. The amount of land used for business purposes grew from 2000 to 2010.
4. Expand these notes into full sentences to describe the graph and bar chart in Exercise 3.
1. cost of residential land = increase / land use for housing = decrease / since 1980
Suggested Answer
Since 1980 the cost of residential land has increased so the land used for housing has decreased.
2. 1990 to 2000 / business land cost = slight rise / land used for shops and offices = same
Suggested Answer
From 1990 to 2000 the cost of business land
only rose slightly so the land used for shops
and offices in Newtown remained the same.
3. since 2000 / cost of business land and business land use = stable
Suggested Answer
Since 2000 the cost of business land and
the amount of land used for business have
remained stable.
4. housing land use / decrease / last 40 years / reason = cost
Suggested Answer
The amount of land used for housing in Newtown
has decreased over the last 40 years due to the
increase in the cost of residential land.
5. land used for offices / from 1980 to 2000 / grew
Suggested Answer
The amount of land used for offices in
Newtown grew from 1980 to 2000.
6. cheapest land = park land / 1980 - 2010
Suggested Answer
Between 1980 and 2010 the cheapest type of
land in Newtown was park land.
|
