|
Exam information | Describing pie charts
A pie chart is a circle (or 'pie') divided into sections. The whole circle represents the total quantity (= 100%) and the sections show how the total may be divided into different shares or proportions. These shares or proportions correspond to different categories. Pie charts are useful for comparing these categories. Proportions are shown as a percentage (%) or fraction (e.g. 1⁄2) of the total quantity.
1. Match sentences 1 -6 to pie chart A or B. Write A or B next to each sentence.

1. Fifty per cent of the DVDs sold in 2009 were comedy films.
2. A third of DVD sales were comedy film s.
3. Thrillers were 25 per cent of the total UK DVD sales in 2009.
4. Horror films were about a quarter of DVD sales in the UK in 2009.
5. In 2009 comedy films were half the total DVD sales in the UK.
6. Less than 10 per cent of DVDs sold in the UK in 2009 were documentary films.
Exam tip | Using approximate language
Pie charts often compare different categories in an approximate way. If the sections of the pie chart are not labelled with precise percentages / fractions, you should describe them using approximate language.
2. Write sentences describing the pie chart using the words / phrases in the box.

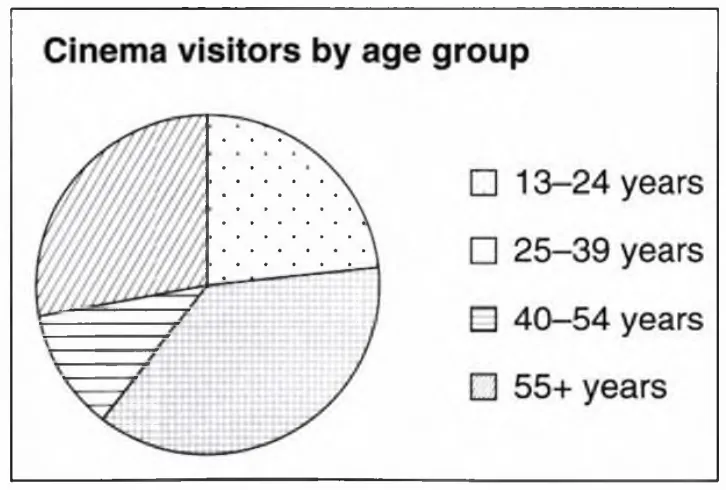
Example: Approximately 10 per cent of cinema visitors are between 40 and 54 years old.
Suggested Answer
Just over a third of cinema visitors are between
25 and 39.
Almost 25 percent of cinema visitors are young
people aged 13 to 24 years old.
Just under a quarter of people who visit the
cinema are between 13 and 24 years old.
Nearly a third of people who visit the cinema are
over 55 years old.
Exam information | Comparing pie charts
For IELTS Task 1 there are sometimes two or three pie charts that you must compare. The pie charts may represent different years and show trends over time. You need to describe the changes and similarities / differences between the pie charts.
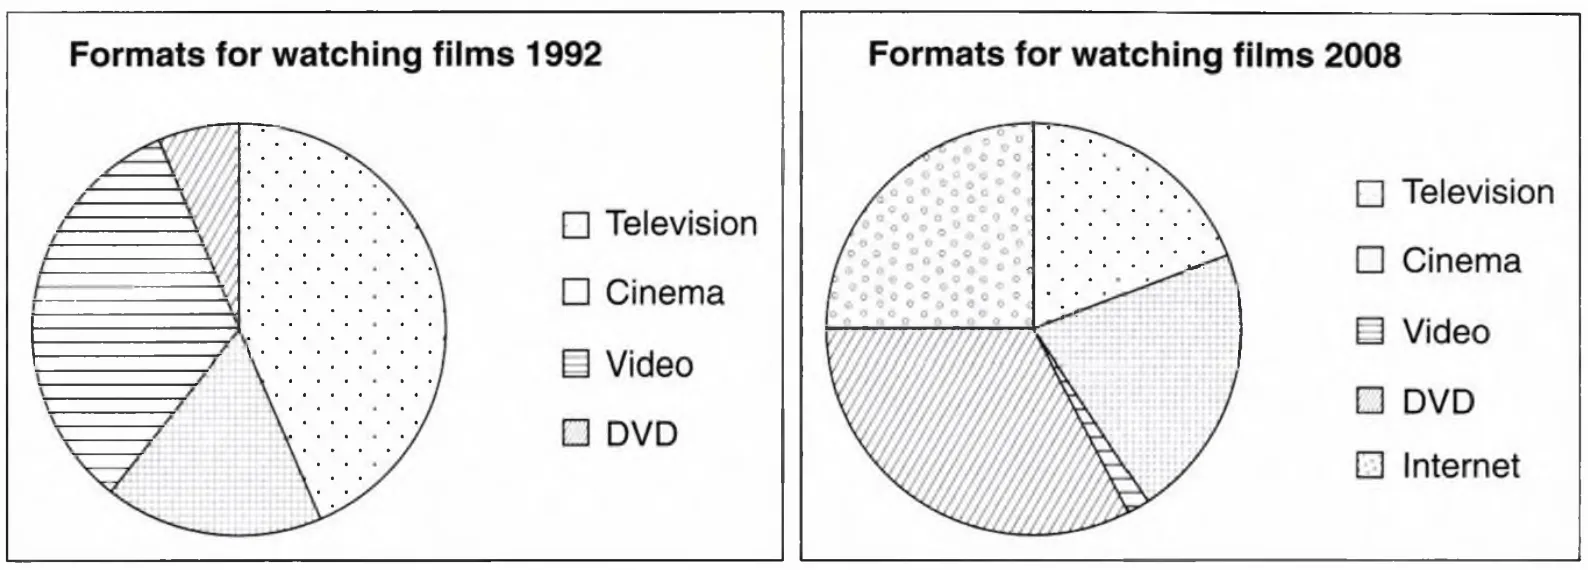
3. Look at the pie charts and decide if the sentences below are true or false. Write T (true) or F (false).

1. The pie charts show how many people watched films in 1992 and 2008.
2. The pie charts show the proportion of films watched on different formats in 1992 and 2008.
3. More people watched films on television in 2008 than in 1992.
4. In 1992 nearly a third of films were watched on video but this amount decreased to about two per cent in 2008.
5. The proportion of people watching films at the cinema was about the same in 1992 and 2008.
6. There was a slight increase in the number of people watching films on DVD from 1992 to 2008.
7. In 1992 no one used the Internet to watch films but in 2008 people used the Internet to watch a quarter of the total films.
8. In 2008 approximately half the films were watched using two formats: cinema and the Internet.
9. From 1992 to 2008 the number of people watching films on television decreased by just over 25 percent.
10. From 1992 to 2008 the number of people watching films on television decreased to approximately half.
1369
1. The pie charts show how many people
watched films in different formats in 1992 and
2008.
3. Fewer people watched films on television
in 2008 than in 1992. / More people
watched films on television in 1992
than in 2008.
6. There was a large increase in the number of
people watching films on DVD from 1992 to
2008.
9. From 1992 to 2008 the number of people
watching films on television decreased by just
over 50 per cent.
Exam tip | By or to?
increase by 10 per cent means that 10% more of a number has been added to it,
e.g. 10 + 1 = 11
increase to 10 per cent means a number was less than 10% and is now 10%, e.g. 8% 10%
4. Complete the text about these pie charts.

The pie charts show the different reasons why (1) buy films. In general most people buy films because of the (2) and the actors. The (3) is the least important reason for people when they buy films.
We can see from the pie chart that almost (4) of men choose films because of the special effects. Another important reason for men is the music at (5) 20 per cent. The reasons for women are different. (6) of women buy films for the story and actors; the other reasons are much less important. Special effects are the least important reason for women at only about (7) . The (8) of men and women who choose films based on the cost is (9) the same at about ten (10) .
Exam tip | Words for quantities
Percentage, amount, number, proportion and quantity can all be used to describe the quantities shown in graphs and charts in Task 1.
The percentage of people who watch horror films decreased.
The proportion of people who watched comedies was larger/smaller in 2011 than in 2010.
The number of people who prefer action films increased.
Teenagers spend a smaller amount / quantity on renting DVDs than older people.
Remember: use amount with uncountable nouns only.
|

